Improving performance is an art. To me, chasing performance issues feels like it flexes the same muscles as debugging. You're wading into the unknown with only a sliver of information. But instead of understanding why it does that one weird thing, you're asking adjacent questions: Where is it slow? Why is it slow? Then of course, How can it be improved?
This post will be the first in a series outlining how I approach improving performance, specifically for laggy UIs built with React. Even though this will mention tools and techniques specific to React, a fair amount of this would transfer to general-purpose optimization work. No matter the environment or tools, I'm trying to answer the same questions.
Note: The second part of this series is out covering the How can it be improved? question.
So, you have a UI that feels slow. Where do you start? This post will cover two big chunks of the process of optimizing React performance:
- Tools
- Where is it slow?
In part two, we'll cover the other half of optimization: React pitfalls and techniques to actually improve performance of your UI.
I'm starting with tooling and the "where" because, like debugging, the hard part is in really understanding what’s going on and what should be improved. I often find that the actual solution to speed up a UI is a couple of small changes. I can't tell you how many times an ill-placed splat or anonymous function passed as a prop has made a UI unusable. Fixing these issues was only possible by understanding which parts of the code needed optimization.
Tools
There are a few browser tools you can use to help you understand where to optimize. Specialized tools aren't the end-all, though. In my experience, they almost never straight-up point out a performance issue. But they can give you a general direction to answer "What is slow?" and tell you how much time something takes.
DevTools profiler
Chrome has a profiler in the dev tools' Performance tab. The profiler can help point out that obvious case where you have a super slow function, or when you are calling a function too many times. Usually it'll show the lowest hanging fruit.
First, start up a profile by opening up the dev tools and clicking record.

Do your slow action, then click stop. It will show you a summary like this.
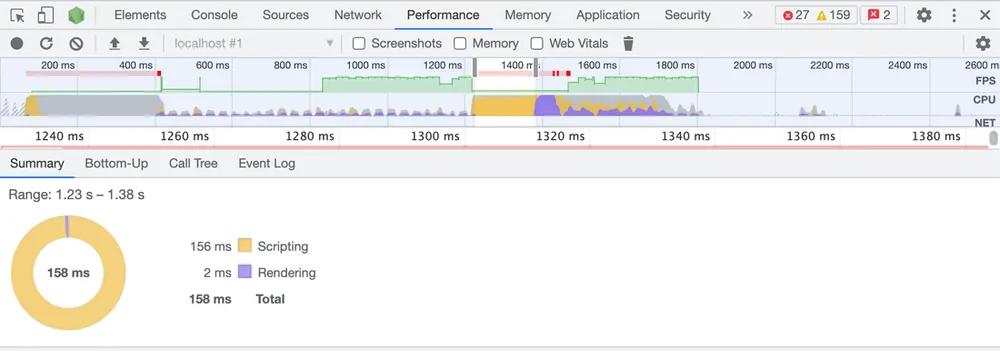
To me, the most useful tab is "Bottom-Up". It will show you which functions took the most time. Since we are focused on JavaScript performance in this post, I'll drag my mouse over the yellow chunks of the timeline, which show JavaScript performance concerns, then select the "Bottom-Up" tab:
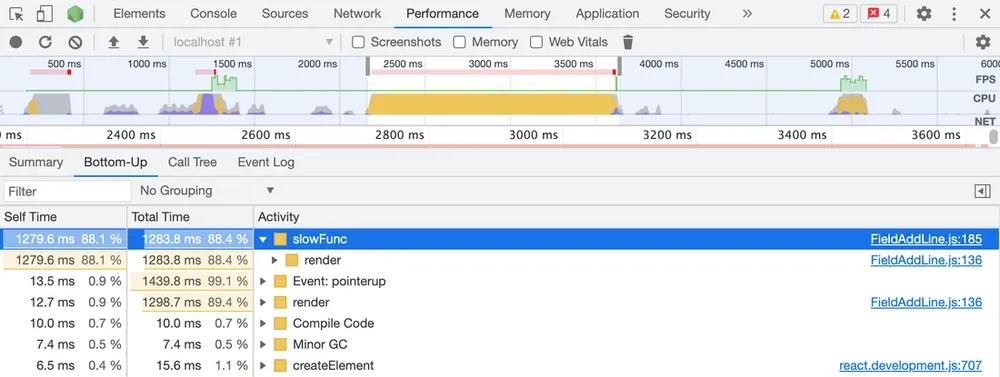 Select the Bottom-Up tab in the 2nd level tabs
Oh hey, a slow function. Lucky us!
- Self Time will tell you how much time was actually spent in this function. You can see that
slowFunc()shows the most "Self Time", so it likely does a bunch of additional processing within its function boundary. That is, it's not calling some other slow function, it is slow itself. - Total Time tells you how much time was spent, including time calling slow child functions. Basically, if this is high and "Self Time" is low, this function is calling a slow function somewhere down its call tree. You can see the 4th line,
render(), has a high "Total Time", but a low "Self Time". It does very little itself, but calls something slow:slowFunc().
You can also dig into the call tree with the carets. By opening slowFunc(), you can see that it is called by render(). If multiple functions are calling slowFunc(), there will be more than one line here.
For reference, our contrived slowFunc() example is the following: render() calls slowFunc() directly.
function slowFunc() {
  for (let i = 0; i < 100; i++) {
    console.log('Hello', Math.random())
  }
}

const SlowComponent = () => {
  slowFunc()
  return "I'm slow :("
}

const App = () => (
  <>
    <SlowComponent />
    <SlowComponent />
    // 100 more SlowComponent renders
  </>
)
This is an extremely simplified case. The obvious solution is to not call slowFunc() here. But what if it is doing necessary work? The real world is often much messier.
JavaScript profiler
Instead of opening the Performance tab and clicking Record, you can programmatically generate performance profiles for later viewing. This is useful if you want to capture a very specific part of the code. For example:
console.profile('The slow thing')
doTheSlowThing()
console.profileEnd('The slow thing')
It works similarly to the "Performance" tab, but In Chrome these show up in a different part of the dev tools: ... -> More tools -> JavaScript Profiler
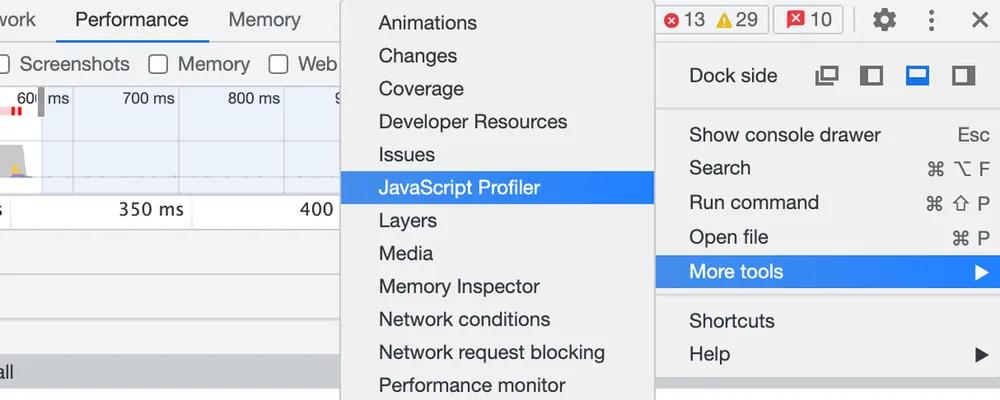 How to access the JavaScript profiler
And it shows your generated profiles:
 Our slowFunc profile in the JavaScript profiler
React profiler
There is yet another profiler, one specifically for React. React developer tools is a Chrome browser extension written by Facebook.
Once it's installed, you will get a new tab. Just like the JavaScript profiler, you can record profiles.
 React developer tools profiler in chrome
Click record, do your slow action, click stop, and you'll get a breakdown of which components rendered and how much time they took.
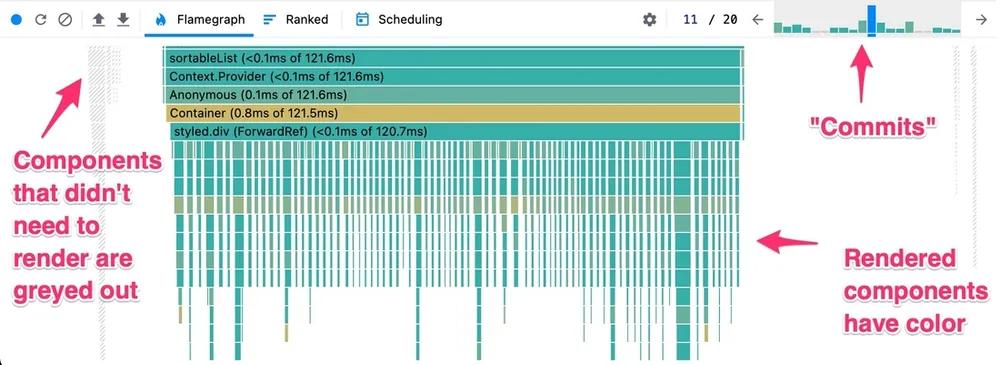 React developer tools flame graph
The profiler breaks down your profile into "commits"; see the chart in the top right of your profile. A "commit" is when React actually applies your rendered components to the DOM. Note that a commit may contain multiple render calls for a given component! In the above screenshot, it's possible Container has been re-rendered 10 times.
Click on the tallest peak in the commit chart and you will see the slowest renders.
This profiler has its own concept of Self Time and Total Time shown in each horizontal bar. For example, in 1ms of 100ms, 1ms is the self time; the time that was spent rendering this component, and 100ms is the total time; the time spent rendering itself and all its children.
You can see I have a lot of components rendering each time I do my slow action. Each one of them takes only a few milliseconds, but it adds up!
console.log()
Let's be honest, logging is probably the most widely used (and dare I say, useful) debugging tool ever invented. It might feel low-tech, but well-placed logging can play a central role in performance optimization. It can be a super fast way to check parts of the code, which we'll get into later in this post. For example:
const start = performance.now()
doSlowOperation()
console.log('Time to do slow operation', performance.now() - start)
This example is a little basic, but it becomes more useful when your start and stop points are asynchronous. For example:
class MyComponent extends React.Component {
  handleStartSlowOperation = () => {
    this.startPerf = performance.now()
    kickOffSlow()
  }

  handleSlowOperationDone = () => {
    console.log('Time to do slow operation', performance.now() - this.startPerf)
  }

  render() {
    // ...
  }
}
Where is it slow?
Let's dig into how to actually find where a laggy UI is slow. I spend a fair amount of time trying to understand where it is slow, as it makes the fixing part significantly easier.
I start by picking an operation that represents the slow condition. Say load up your UI with a lot of data, then type into that slow input box, or click that slow button. The more quickly repeatable the scenario, the better. Can you repeatedly type into the slow input box and have it feel slow? That's the best scenario.
My examples will be based on an optimization in Anvil's webform builder. For context, our webform builder is a piece of our Workflows product. Clients create custom sharable webforms in the builder by adding and modifying input fields. Clients can use the webforms they build to collect data from their users. Once the user has filled out the webform, our clients can use the data from the webform to fill PDFs and gather signatures.
We recently optimized rendering when there were a lot of fields on a webform page. e.g. our client creates a webform page with 100 input fields.
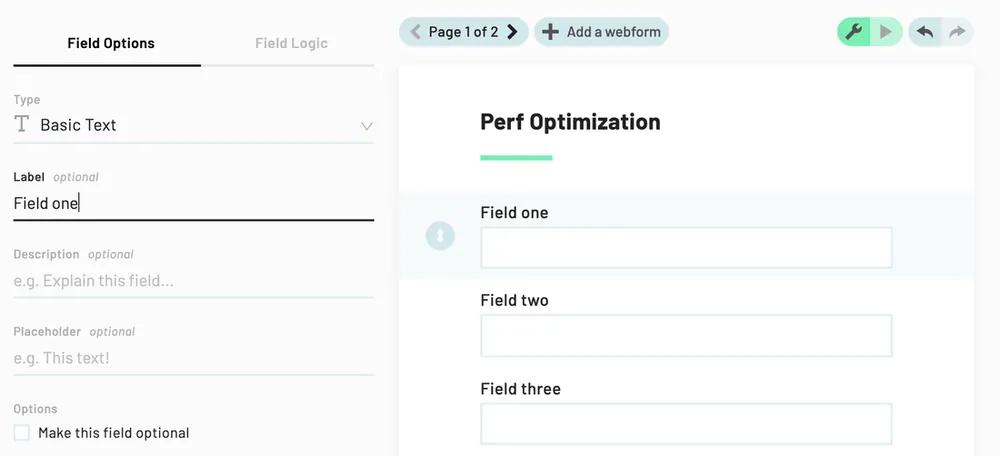 Anvil's webform builder
In our example case, it will be typing a single character into the label field in the left panel. When you change this label value, it will change the selected input field's label in the right panel. There was a noticeable lag when changing a field's label on a webform with many fields.
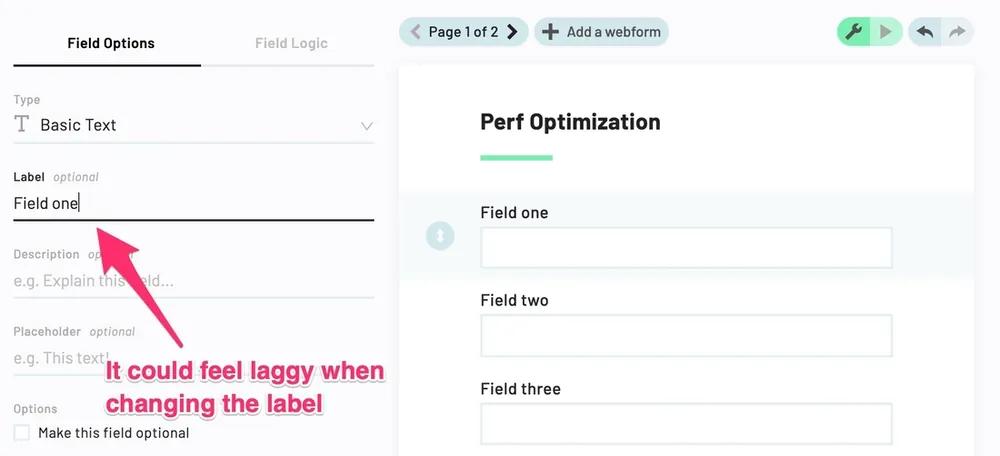 Changing an input field's label can feel laggy
With my slow operation chosen, I get to tracking down the slowest parts of the code within that operation. You might be thinking, "I mean, it's slow when I type into the slow input box". But where where is it slow? That one keystroke might trigger hundreds of components to re-render or several expensive operations to run, maybe even a number of times.
The first goal is to isolate what is slow, down to some function(s) or part of the DOM tree.
Profiling
The profiling tools mentioned above will be the most help in this "Where" stage of optimization. I follow mostly the same process each time I am tracking down inefficiencies in a slow UI.
First, I use the DevTools profiler mentioned above. Usually it can help point out any obvious slowdowns.
1. If a function in your codebase shows a high "Self Time", that is a good candidate for optimization. It's possible it's getting called a ton, or it's just plain inefficient.
 Note that the Self Time is high here
2. If a non-React 3rd party library function shows a high "Self Time", likely something is calling it too often. For example, I added this snippet to the our webform Field component's render function:
for (let i = 0; i < 10; i++) {
  _.uniq(_.times(10000))
}
You can see lodash functions at the top of the list:
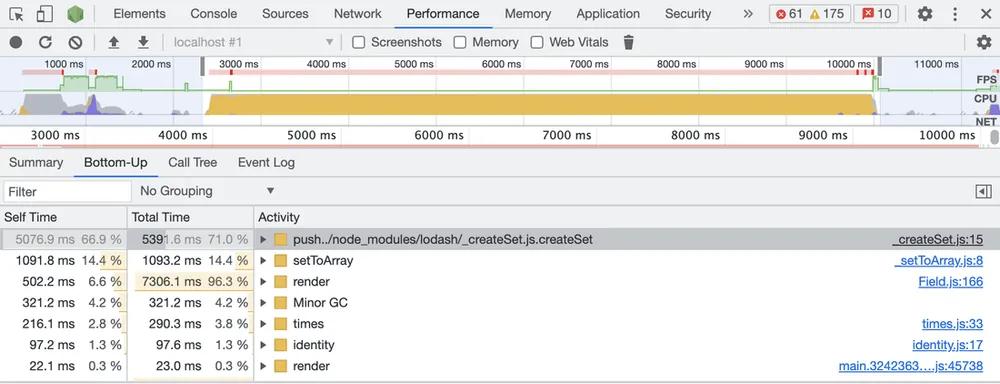 Something is calling a library function too often
The trick here is to drill down into the call tree for each of these items and figure out exactly where in your code base this is being called, how often, etc. It's easy to blame a library function for being slow itself, but in my experience the issue is almost always with how it's being used in our own codebase.
3. If the profiler shows mostly React library functions at the top of the "Bottom-Up" list, then some component is slow to render, or is being rendered too many times.
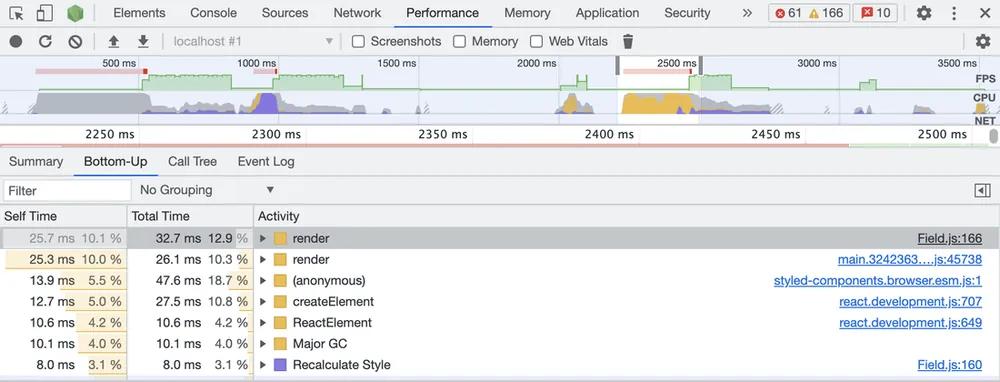 All react all the way down
If you see this, it's time to dig into the React profiler. Here is the same action in the react profiler:
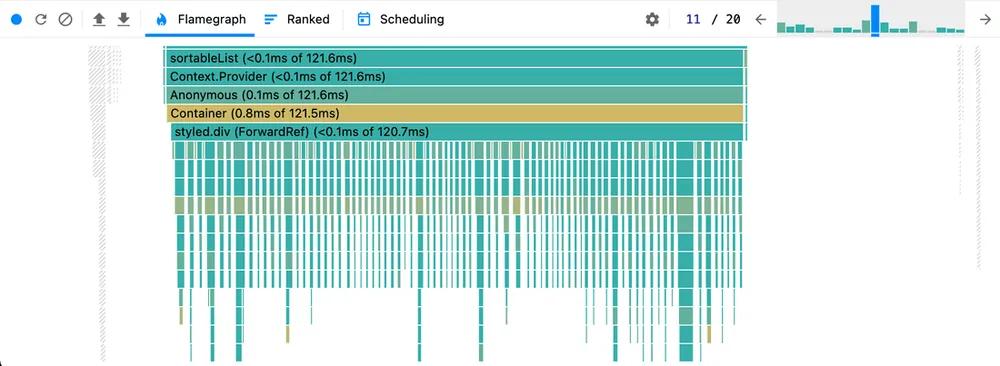 Dig into the React profiler
You can see the slow render is made up of a ton of other component renders. Each of these renders takes up only a few milliseconds, but it adds up to a lag.
The above React profile is from the webform editor example; it looks like every keystroke is causing a re-render of all fields, even for fields whose label isn't being updated.
In my example case, I now have a basic direction: look into the component that is rendering all those fields.
Establish a baseline
The next thing I like to do after having some direction from the profiling tools is to figure out how much time my specific action is taking now.
I've found relying on the profiles for this info isn't so precise. Profiling can also impact the performance of the action you're taking. I want to see a number that is pretty consistent run-to-run and keep the action's real world feel. Instead of profiling, I like to add logging around the slow action. Having a consistent number run to run can show you how much it improves as you change code.
It can be challenging to exactly wrap your action in React. When dealing with rendering performance, it often involves using the componentDidUpdate func. In my case, it will look something like:
class Editor extends React.Component {
  handleKeystroke = (event) => {
    this.startTime = performance.now()
    this.lastChange = {
      label: event.target.value,
      index: event.target.index,
    }
    this.props.onChangeLabel(event)
  }

  componentDidUpdate = () => {
    const lastChange = this.lastChange
    if (this.props.fields[lastChange.index].label === lastChange.label) {
      console.log('Keystroke millis', performance.now() - this.startTime)
    }
  }

  render() {
    // ...
  }
}
This doesn't need to be pretty code, it's temporary
Pressing a keystroke in my example, I can now see how much time is being spent between pressing the key and rendering.
This is my baseline: around 1000ms. You can see here that it's actually being rendered twice on a change, not ideal.
 My baseline for my slow keystroke operation
Delete
At this point, after profiling and creating a baseline, it's possible you have a really good idea of exactly what is slow. If so, that is awesome, and you can probably stop to improve the slow parts.
In complex code bases, however, things might not be very straightforward. It may not be clear which part of the render function is slow, what is causing all the re-renders, or which components shouldn't re-render. If you're looking at, say, a slow data-transformation function, it helps to know exactly which loop or operation is causing the pain.
A lot of times, once I have a baseline, I employ another extremely high-tech technique to narrow the path further: deleting code. I'm trying to answer: How fast could it be? Where exactly will make the biggest impact?
In the case of my example, the react profiler shows a lot of renders for each field.
 Each input field is being re-rendered on a change to one field
Here, rendering could possibly be improved by either re-rendering fewer Field components, or optimizing the render method in each Field component. Intuitively, it feels like the best option is just to render fewer components here, but we won't really know until we try and note the change in performance.
The process is very much the scientific method: have hypotheses, then quickly test them. The UI doesn't even need to be totally functional during this process; this just gives you an idea of where you should spend your time.
For our example: how long does the action take when we do basically nothing in each Field component's render func? We still render all field components, but each does the absolute minimum: only render an empty div in the Field render function. How much does that impact the total time?
const Field = () => <div />The parent renders 100 Fields that are just divs
An order of magnitude improvement, great!

Now, is the issue the rendering of the children itself, or building the props? We can test this by still rendering all fields, building the props to render children, but only rendering the div.
const Field = () => {
  // Is props setup slow?
  const fieldInfo = buildFieldInfo()
  return <div />
}
The parent renders 100 Fields that build props, then render divs
Back close to 1000ms, not great. It seems the actual rendering is less of an issue and now we know building the props could be a place to dig in.

Let's look into only rendering a single component on change. We can first return false from shouldComponentUpdate. shouldComponentUpdate is a React lifecycle function that allows you to control when something re-renders. Returning false from it will tell React to render the component only once (initially), then never again. This will tell us how much it takes to render the parent on a label change.
I'll dig more into shouldComponentUpdate in the next post in this series.
class Field extends React.Component {
  shouldComponentUpdate(nextProps) {
    return false
  }

  render() {
    const fieldInfo = buildFieldInfo()
    return <TheFieldComponents {...fieldInfo} />
  }
}
None of the 100 Fields re-render on a label change
Ok, it's reasonably fast.

Next, I can add a dirty check to shouldComponentUpdate. This check might not be totally correct, but we can simulate what it looks like to only render the changed field. Note that we are doing a full render in the Field component's render func, instead of just rendering a div like in other examples.
class Field extends React.Component {
  shouldComponentUpdate(nextProps) {
    return this.props.field.label !== nextProps.field.label
  }

  render() {
    const fieldInfo = buildFieldInfo()
    return <TheFieldComponents {...fieldInfo} />
  }
}
Only the changed Field re-renders on a label change
Fully rendering only the changed field, even though it is less-than-efficient when building props, is about 105ms.

In the React profiler, we can see my change only renders the affected fields. Note all the greyed out components under styled.div:
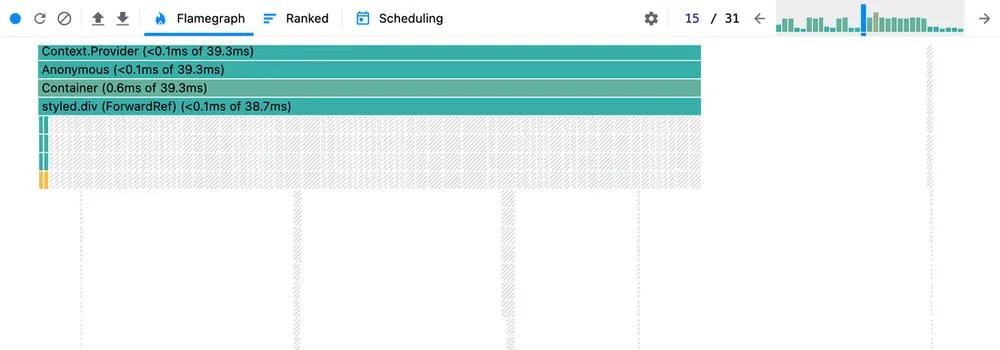 The greyed out components did not render
Analysis
After profiling and strategically deleting code in my example, I have direction as to where I should spend my time.
Remember, we were typing a single keystroke to change the label for a single field in a large list of fields.
 Our example: type a character into the label field here
The experimentation has given me a pretty good idea of the shape of performance behavior:
- On changing a label with a single keystroke, it's rendering all input
Fieldcomponents in the webform twice. Does it need to? - It's rendering all input
Fieldcomponents on changes that do not necessarily affect all fields. - It is possible to be fast rendering all fields, but building the props to render a single
Fieldcomponent is a bottleneck. This doesn't seem to be a huge problem when only one field changes, but it could be a big deal for changes that do affect all fields, or initial render.
Since typing a single keystroke was the initial problem, my approach would be to first get excessive re-rendering under control. Clean up the double renders, and only render the changed Field component. Then if there was time, I would dig into fixing props-building for each Field render.
Going through the exercise of understanding what is slow has also given me some ballpark numbers.
- I now know I can reasonably shoot for ~80-100ms for a change that renders a single field; the parent component takes up about 70ms.
- Rendering all fields in ~100ms isn't out of the question. If I can make building props for a single field more efficient, I can likely get close.
- Typically when typing, animating an element on a user action, or other things that run 'in band' of user input, you need to finish all work within a ~16ms window (60 frames per second) to avoid the user feeling a lag. It appears that fitting into this 16ms is out of reach for our example keystroke.
- The work we are doing in the example doesn't necessarily need to happen on every keystroke. There are techniques like debouncing, which will keep user input feeling fast, then does the work once the user is finished typing. I will dig into debouncing and other techniques that can help us solve this in the next post.
Next up: improving performance
Now you have some tooling and approaches for tracking down the slow parts of your code. In the next post, we'll cover React pitfalls, understanding React re-renders, then techniques to actually fix performance issues in your UIs.
Have feedback on this post? Or are you developing something cool with PDFs or paperwork automation? Let us know at developers@useanvil.com. We’d love to hear from you!

